
Page 140 - SC Annual Report 2018 (ENG)
P. 140
Securities
Commission
Malaysia
ANNUAL
REPORT
2018
For non-financial asset, the fair value measurement takes into account a market participant’s
ability to generate economic benefits by using the asset in its highest and best use or by selling
it to another market participant that would use the asset in its highest and best use.
When measuring the fair value of an asset or a liability, the SC uses observable market data as
far as possible. Fair value are categorised into different levels in a fair value hierarchy based on
the input used in the valuation technique as follows:
Level 1: quoted prices (unadjusted) in active markets for identical assets or liabilities that the
SC can access at the measurement date.
Level 2: inputs other than quoted prices included within Level 1 that are observable for the
asset or liability, either directly or indirectly.
Level 3: unobservable inputs for the asset or liability.
The SC recognises transfers between levels of the fair value hierarchy as of the date of the event
or change in circumstances that caused the transfers.
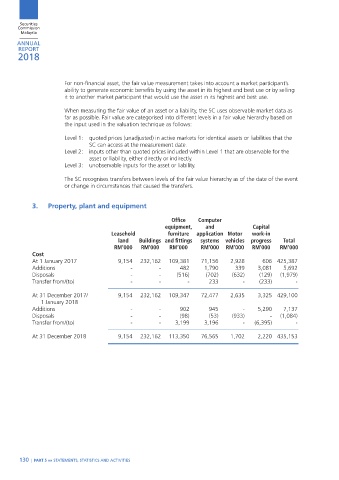
3. Property, plant and equipment
Office Computer
equipment, and Capital
Leasehold furniture application Motor work-in
land Buildings and fittings systems vehicles progress Total
RM’000 RM’000 RM’000 RM’000 RM’000 RM’000 RM’000
cost
At 1 January 2017 9,154 232,162 109,381 71,156 2,928 606 425,387
Additions - - 482 1,790 339 3,081 5,692
Disposals - - (516) (702) (632) (129) (1,979)
Transfer from/(to) - - - 233 - (233) -
At 31 December 2017/ 9,154 232,162 109,347 72,477 2,635 3,325 429,100
1 January 2018
Additions - - 902 945 - 5,290 7,137
Disposals - - (98) (53) (933) - (1,084)
Transfer from/(to) - - 3,199 3,196 - (6,395) -
At 31 December 2018 9,154 232,162 113,350 76,565 1,702 2,220 435,153
130 | PART 5 »» STATEMENTS, STATiSTiCS ANd ACTiviTiES
NEW_90-222.indd 130 2/21/19 9:30 AM