Page 85 - SC Annual Report 2018 (ENG)
P. 85

Securities
                                                                                                                     Commission
                                                                                                                      Malaysia
                                                                                                                     ANNUAL
                                                                                                                      REPORT
                                                                                                                     2018


                           spreads also widened in line with the exchange   lived as the release of stronger-than-expected
                           rate dynamics. Nevertheless, the pressures were   US labour market data led to the upward shift
                           uneven across EMEs, reflecting differentiated   in US interest rates expectations. The rise in US
                           stress conditions related mostly to economic    Treasury (UST) yields accelerated in late January,
                           fundamentals and policy frameworks. Emerging    preceding the US equity market correction. This
                           Asia, in particular, continued to exhibit resilient   subsequently spread to other major markets. Market
                           financial market performance, given the region’s   correction re-occurred in October, triggered by
                           solid macroeconomic fundamentals and lesser     unsustainably high US equity valuations on the back
                           dependence on external financing (Chart 4).     of challenging global macroeconomic outlook. The
                                                                           trend exacerbated through the final part of the year,
                           After a prolonged period of low volatility in the   wiping off 2018 gains as the abrupt decline in oil
                           preceding year, 2018 marked the return of global   prices in November, alongside the inversion of the
                           financial market volatility (Chart 5), with broad-  UST 5/3 yield curve in early December, collectively
                           based increase in volatility across all asset classes   contributed to the widespread risk-off sentiments
                           especially in the latter part of the year. The strong   across all markets.
                           equity prices at the start of the year was short-
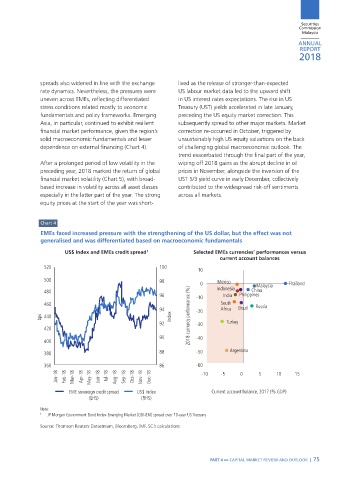

                           Chart 4

                           EMEs faced increased pressure with the strengthening of the US dollar, but the effect was not
                           generalised and was differentiated based on macroeconomic fundamentals

                                   US$ Index and EMEs credit spread 1           Selected EMEs currencies’ performances versus
                                                                                          current account balances
                            520                                     100
                                                                                  10
                            500                                     98             0     Mexico       Malaysia    Thailand
                            480                                                          Indonesia   China
                                                                    96           -10       India  Philippines
                            460                                                           South       Russia
                                                                    94           -20      Africa  Brazil
                           bps  440                                     Index  2018 currency performance (%)
                                                                    92           -30        Turkey
                            420
                                                                    90           -40
                            400

                            380                                     88           -50         Argentina

                            360                                     86           -60
                                Jan-18  Feb-18  Mar-18  Apr-18  May-18  Jun-18  Jul-18  Aug-18  Sep-18  Oct-18  Nov-18  Dec-18  -10  -5  0  5  10  15


                                     EME sovereign credit spread   US$ Index           Current account balance, 2017 (% GDP)
                                            (LHS)             (RHS)
                          Note:
                          1   JP Morgan Government Bond Index-Emerging Market (GBI-EM) spread over 10-year US Treasury
                          Source: Thomson Reuters Datastream, Bloomberg, IMF, SC’s calculations


                                                                                       PART 4 »» CAPITAL MARKET REVIEW AND OUTLOOK  |  75


              NEW_70-89.indd   75                                                                                        2/21/19   9:29 AM
   80   81   82   83   84   85   86   87   88   89   90