
Page 21 - Inspection Report 2018
P. 21
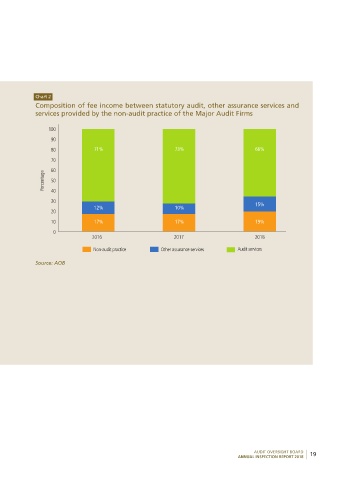
Chart 2
                         Composition of fee income between statutory audit, other assurance services and
                         services provided by the non-audit practice of the major Audit Firms


                             100
                              90
                              80             71%                          73%                         66%

                              70
                            Percentage   60
                              50
                              40
                              30                                                                      15%
                                             12%                          10%
                              20
                              10             17%                          17%                         19%
                               0
                                             2016                        2017                         2018

                                             Non-audit practice      Other assurance services   Audit services

                         Source: AOB


                                                                                                      AUDIT OVERSIGHT BOARD
                                                                                                ANNUAL INSPECTION REPORT 2018  19


              83806_Inside_NEW.indd   19                                                                                 5/28/19   3:02 PM