Page 31 - Inspection Report 2018
P. 31

Data Analytics


                           Application in Financial Statements Audits by the Big-Four Audit Firms


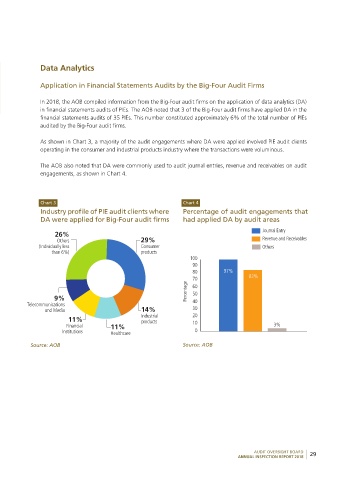
                           In 2018, the AOB compiled information from the Big-Four audit firms on the application of data analytics (DA)
                          in financial statements audits of PIEs. The AOB noted that 3 of the Big-Four audit firms have applied DA in the
                           financial statements audits of 35 PIEs. This number constituted approximately 6% of the total number of PIEs
                           audited by the Big-Four audit firms.

                           As shown in Chart 3, a majority of the audit engagements where DA were applied involved PIE audit clients
                           operating in the consumer and industrial products industry where the transactions were voluminous.


                           The AOB also noted that DA were commonly used to audit journal entries, revenue and receivables on audit
                           engagements, as shown in Chart 4.


                           Chart 3                                           Chart 4
                           Industry profile of PIE audit clients where       Percentage of audit engagements that
                           dA were applied for Big-Four audit firms          had applied dA by audit areas

                                                                                                         Journal Entry
                                26%
                                Others                        29%                                       Revenue and Receivables
                          (Individually less                  Consumer                                  Others
                               than 6%)                       products
                                                                               100
                                                                                90
                                                                                80         97%
                                                                                70                  83%
                                                                              Percentage  60
                                                                                50
                               9%                                               40
                      Telecommunications
                            and Media                         14%               30
                                                              Industrial        20
                                    11%                       products          10
                                    Financial      11%                                                       3%
                                  Institutions     Healthcare                    0

                       Source: AOB                                           Source: AOB


                                                                                                      AUDIT OVERSIGHT BOARD
                                                                                                ANNUAL INSPECTION REPORT 2018  29


              83806_Inside_NEW.indd   29                                                                                 5/28/19   3:02 PM
   26   27   28   29   30   31   32   33   34   35   36